Solutions

Platform

Four Products, One Study

Novasyne builds software for clinical and translational research that works with physiological data as it actually arrives: raw amplifier files, wrist recorder exports and wide biomarker tables. STUDYPRO runs the trial. The three workbenches take the recordings that trial collects and turn them into results.

Each product runs in the browser, installs in hours rather than months, and exports in the open formats your statisticians already use.

Principles

Built For Research

Nothing is hidden behind a summary. Every inference the software makes is visible and can be overridden, every preprocessing step is recorded and travels with the file on export, and every automated interpretation names the literature it drew on.

Where a method does not fit the data, the software says so rather than returning a number that looks plausible. Repeated measures are flagged. Multiple testing is corrected. Import problems are reported, never quietly skipped.

Clinical Trial Management

STUDYPRO

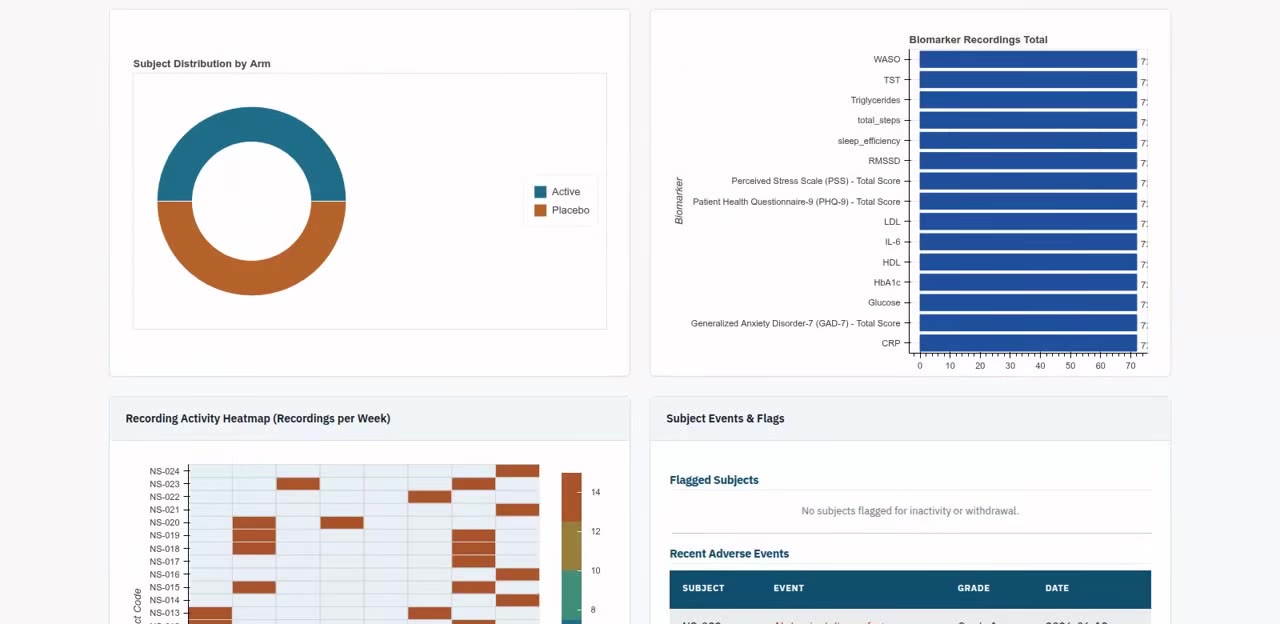
A complete clinical trial management system built for academic institutions, hospitals and investigator initiated research. Studies, subjects, visits, consent, adverse events, budgets and documents live in one place, alongside the physiological recordings the trial collects. Where legacy systems treat high frequency data as an attachment, STUDYPRO stores EEG, wearable and imaging recordings as study data in their own right, ready to visualise and analyse without leaving the platform.

  • Guided study creation with interventional, observational, registry, case control and sensory templates
  • Subject roster with demographics, cohort allocation, consent versioning and concomitant medication
  • Dashboards for enrolment, recording compliance, adverse events and budget burn
  • Every observation the study has collected on one timeline, with a calendar of collection
  • Cohort comparison with t tests, ANOVA, Mann-Whitney U and Kruskal-Wallis, with effect sizes
  • Retrieval augmented AI reporting over your own protocols and literature, with citations
  • Immutable audit trail, MedDRA coded adverse events and GCP aligned workflows
  • Export to CSV and Excel for R, Python, SPSS and SAS
Watch the demo Download the user guide User guide, PDF, 57 pages, 13 MB
STUDYPRO study dashboard showing cohort distribution, recording totals and a per subject activity heatmap

Study dashboard: allocation, recording totals, weekly compliance and open adverse events
Wearable Signal Analysis

Wearable Workbench

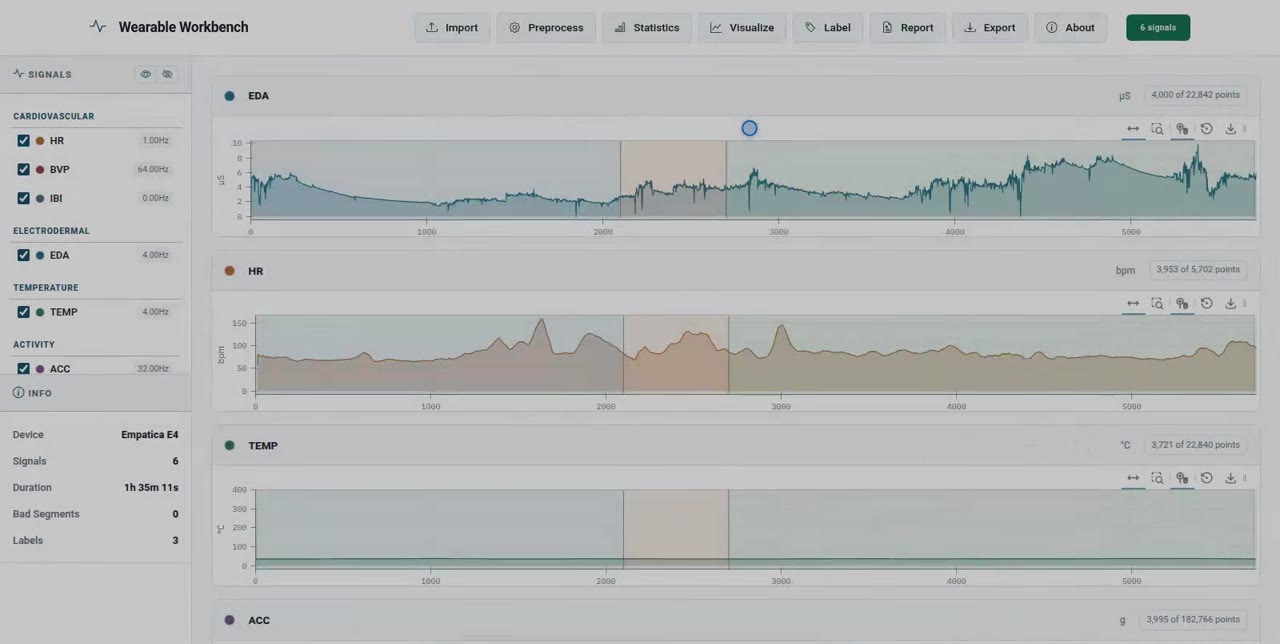
Browser based analysis for research grade and consumer wearables. Drop in the archive the device portal produced and every device lands in the same Universal Wearable Format, so an Empatica session and a Garmin export are analysed the same way and compared on the same axes. Twenty three devices are supported today, and the format is what makes the comparison possible.

  • Empatica E4 and EmbracePlus, Oura, Garmin, Wahoo, COROS, Suunto, Fitbit, Apple Health, Withings, ActiGraph, Axivity, GENEActiv, Actiwatch, movisens, Shimmer3, Dexcom, FreeStyle Libre and more
  • Every signal on one clock, with zoom, pan and experiment labels overlaid on each trace
  • HRV in the time domain, the frequency domain and nonlinear: SDNN, RMSSD, pNN50, LF/HF, Poincaré SD1 and SD2, sample entropy
  • EDA split into tonic level and phasic responses, with response count, rate, amplitude and area under the curve
  • One click preprocessing per signal type, with a history that travels with the file on export
  • Automatic detection of missing data, motion artifact and poor signal quality, plus manual marking
  • Coverage, correlation, histogram, Poincaré, spectrogram and hour of day visualisations
  • Interpreted report placing every measurement against published reference ranges, each citation named. Only summary statistics are sent for interpretation, never raw samples.
Watch the demo Download the user guide User guide, PDF, 38 pages, 7 MB
Wearable Workbench showing electrodermal activity, heart rate and temperature on a shared time axis with three experiment labels overlaid

An Empatica E4 session: six signals on one clock, with baseline, stress and relax labels overlaid on every chart

Electroencephalography

EEG Workbench

A full EEG analysis environment in the browser, from the raw file the amplifier wrote through to event related results. It reads EDF, BDF, FIF, BrainVision and EEGLAB, takes the format from the file rather than asking you for it, and gives you the recording itself rather than a summary of it.

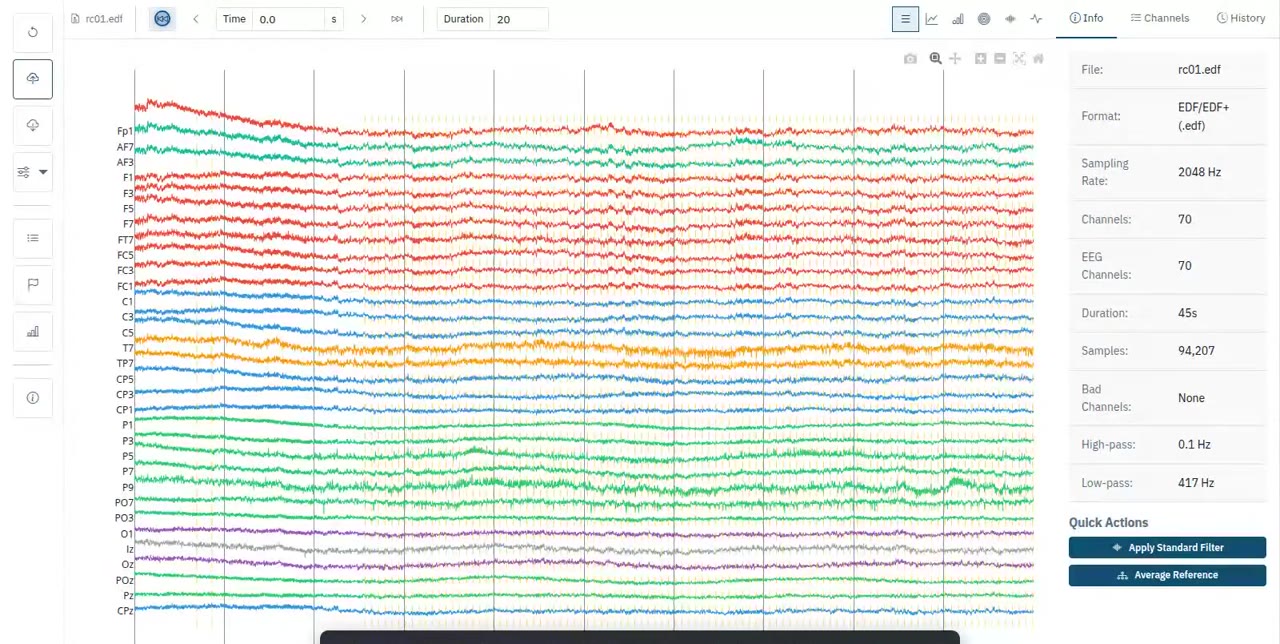
  • Seventy channels on one time base, decimated for the browser, with a window from five seconds to a minute anywhere in the recording
  • Power spectral density and band power, with topographic maps at any instant, per band, or every band at once
  • Time frequency for the visible window, as a spectrogram or through Morlet wavelets
  • Filtering, line noise removal and re-referencing, with presets, and each step listed as it completes
  • Epoching around markers with baseline correction
  • ERP waveforms with confidence bands, butterfly plots, single trial ERP images and scalp topographies at the latencies you choose
  • ERSP and inter trial coherence once the recording has epochs
  • Band power, spectral slope, coherence and frontal alpha asymmetry, and export as FIF, EDF, BrainVision, EEGLAB or CSV per epoch
Watch the demo Download the user guide User guide, PDF, 47 pages, 23 MB
EEG Workbench showing thirty two channels of a clinical EDF recording on a shared time base

A clinical EDF at 2048 Hz: thirty two channels on one time base, with everything the file declares about itself alongside

Biomarker Discovery

Analytics Workbench

Biomarker discovery for clinical and translational research. Import a tidy CSV of subjects by biomarkers and the profiler infers what every column is, then takes you from summary statistics through group comparisons to a corrected screen across the whole panel. It is built to stop the two mistakes that cost studies their conclusions: treating repeated measures as independent subjects, and testing fifty biomarkers without correction.

  • Column role inference for identifiers, time, covariates and measurements, all of it visible and overridable
  • Summary statistics across every column, with five plot types available straight off the data preview
  • Distributions, correlation matrices and missing data screens
  • Group comparison with the test the data demands, including independent t test, Mann-Whitney U, ANOVA and Kruskal-Wallis
  • Repeated measures detected and flagged before a p value is reported
  • Batch screening across the whole biomarker panel with FDR or Bonferroni correction and effect sizes
  • Principal component analysis and a cross domain biomarker network
  • A research assistant that answers from the numbers it was given, statistical facts first and interpretation second, with the limits stated
Watch the demo Download the user guide User guide, PDF, 55 pages, 16 MB
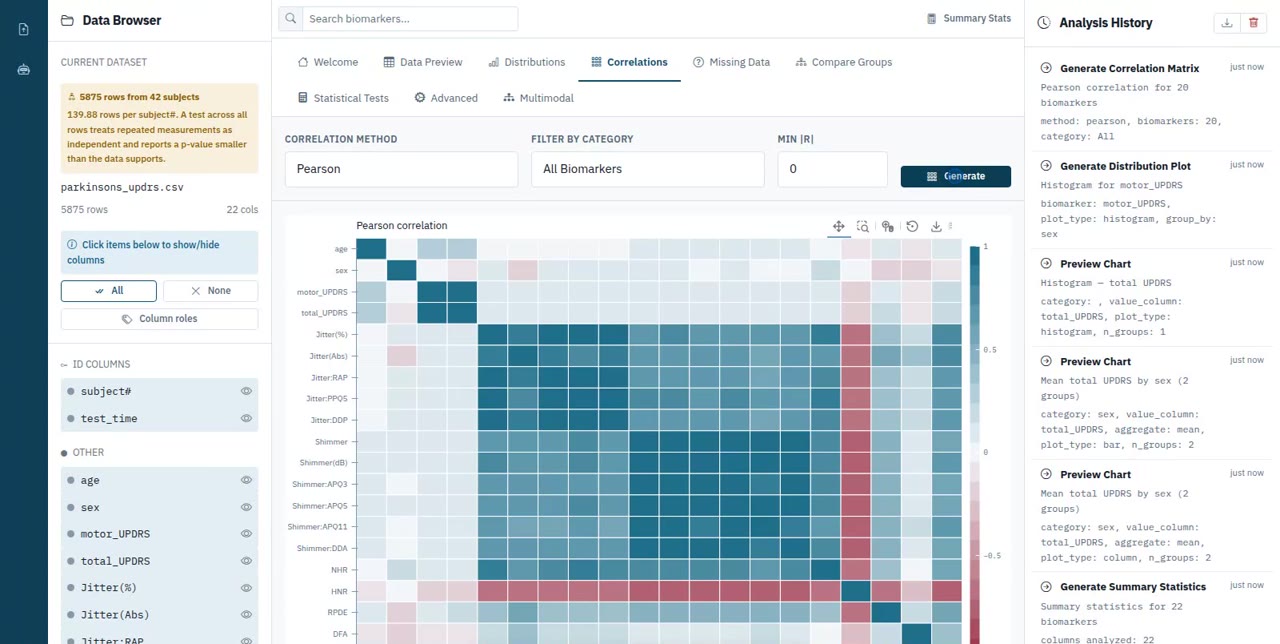
Analytics Workbench showing a Pearson correlation matrix across twenty biomarkers

Correlation structure across every biomarker in the panel, from a 5,875 row telemonitoring dataset

4

Products

23

Wearable Devices Supported

5

EEG Formats Read And Written

36

Projects & Research Publications